with real-time global freight pricing, booking and procurement across hundreds of carriers, thousands of forwarders and tens of thousands of importers and exporters around the world, big and small.
We’re bringing global freight online with the only vendor-neutral global freight booking and payment platform. Ready to impact the way the world moves?
I chose Freightos because of their clear, challenging, and exciting goal: digitizing the freight industry. We’re constantly learning from great professionals and great people, and meet teams from different countries and cultures.
Ferran Bosch
R&D Director
The work environment here is extremely heterogeneous and inclusive: I get to work with colleagues and clients from different ethnicities and cultures. This enhances the work we do and makes a difference in my daily and professional lives.
Nadia Vergani
Sales Executive Ebookings
Freightos does a fantastic job of hiring like-minded, dynamic, and optimistic people. Their HR policies help make employees feel looked after, giving them encouragement to do their jobs well, and have a positive outlook on their careers and personal life.
Joe Marris
Product Marketing Specialist
What I like most about Freightos is the people; truly inspiring professionals who work hard, while still enjoying the small moments. A good inside joke can make my day. I have never felt as appreciated & “spoiled” as I do in Freightos.
Mary Abu Ghattas
HR Business Partner
Before I officially started at Freightos, they sent me a gift for Eid. And again, when my daughter Salma was born, which really meant a lot to me. Managers here are close and accessible. There isn’t a gap between employee and manager like at other companies.
Oday Ashour
Software Development Engineer
On an individual level, there are budgets for training, and team building. On a professional level, there are opportunities to learn new technologies, to investigate and experiment. At Freightos, they don’t say, “it can’t be done this way”. They say “try it”.
Sija James
R&D Manager
I chose Freightos’ WebCargo because of the agility of the process and because I saw many opportunities for growth. The fact that they bet on me, a junior member, was very encouraging to me. The company gives you the opportunity to grow.
Daniella Álamo
Junior SDE
At Freightos there’s a real focus on professional development, learning new skills, adding new responsibilities, and making sure employees are feeling challenged and engaged.
Judah Levine
Research Lead
I like how professional the team is, how they respect everyone’s time, and how they give me space to be myself & to shine. Freightos empowers everyone to work on themselves & truly supports career growth.
Fatima Alkilani
Product Manager
I joined Freightos because of their reputation: “flexible environment”, “nice people”, “challenging and exciting”. When I joined, it was just as described! I love how much Freightos cares about our well-being, life-work balance and our career development.
Nizar Hawawreh
Senior Software Development Engineer
Since day one, Freightos helped me to find my passion! I had a memorable journey that started many years ago working with our customers’ data. Today, I’m managing a big global team in three different countries. Freightos has been the place where I learned, grew, and continue to reach my potential.
Rawan Rimawi
Operations Director
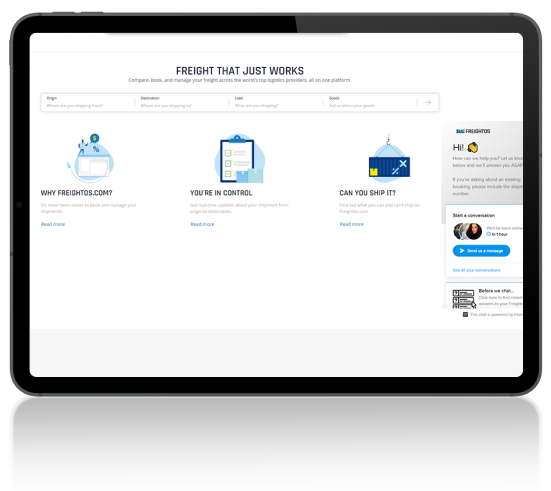
Get a demo of Freightos.com’s Enterprise Shipper capabilities
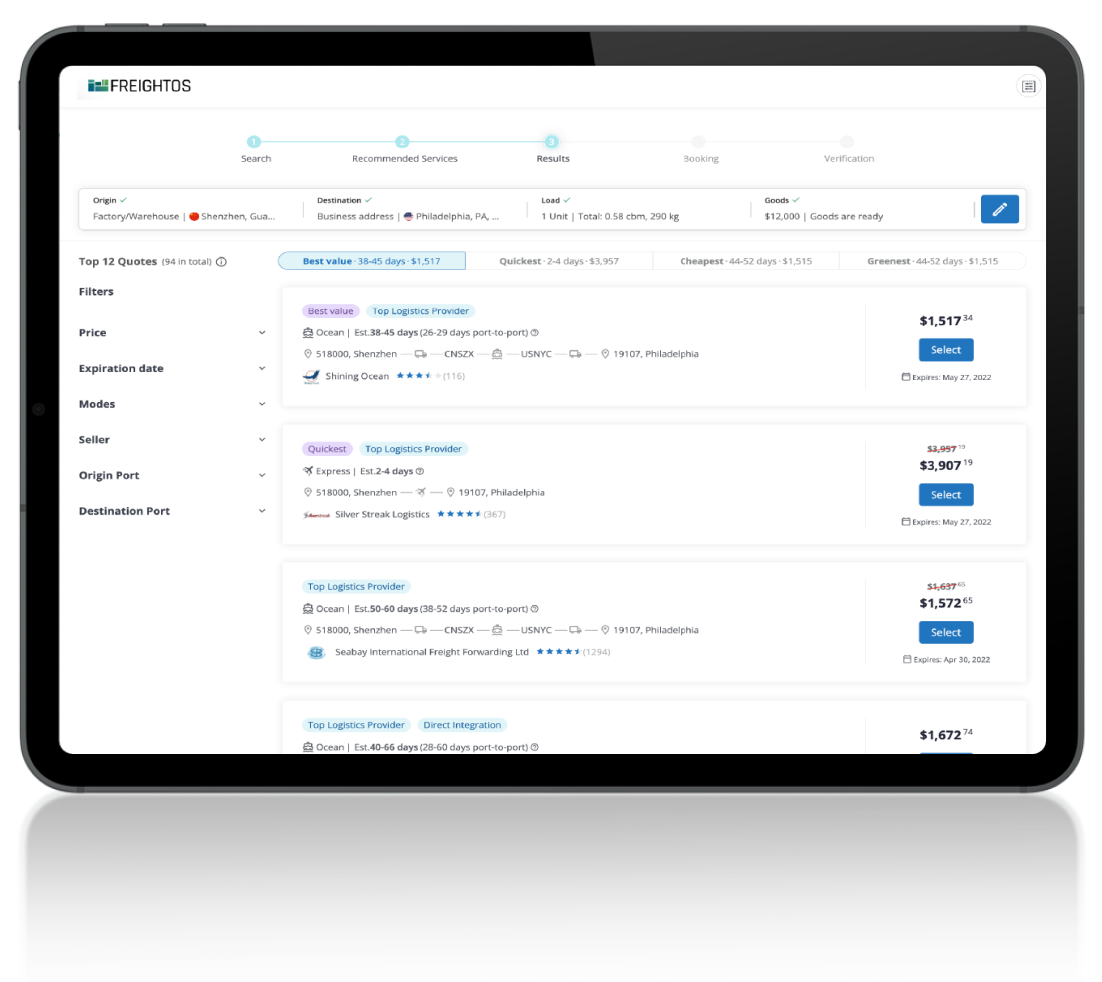
Freightos.com helps you spend less time and money on each shipment, reducing spend with better:
Improved selection across price, mode, vendor, performance metrics on each shipment
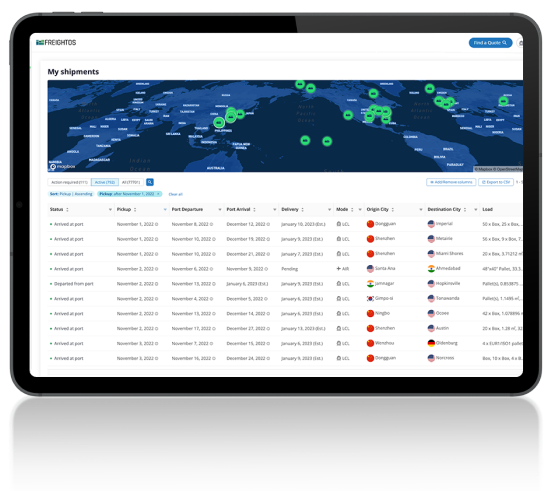
Reduced management time with on-demand documentat management and tracking
Real-time service through automated services, real-time chat, and integrated messaging options
Powerful payment options, including credit, batch processing, reconcilations and more.